

Resurgent growth in the post-COVID world has rekindled talk of the next ‘supercycle’ for industrial commodities. But beneath the headlines, the reality is that this demand is likely to pale in comparison with the driver of the original supercycle.
Is the Chinese dragon losing its appetite for industrial metals?
18 August 2021
Article last updated 20 January 2023.
For many years the fortunes of the FTSE mining sector have been linked to developments in China. Rapid growth in demand for commodities like iron ore and copper in the late 2000s led to what became known as the first mining supercycle. That was followed by a downturn from 2011—15 as slowing demand from China combined with overexpansion of mining production.
In recent years commodity prices have rallied back towards previous highs and the FTSE mining sector has regained much of its lost ground. But some caution is required — demand from China is unlikely to repeat the growth of the 2000s and we don’t see a new driver of supercycle-style demand emerging.
China remains by far the dominant demand driver for most metals — accounting for over 60% of global iron ore and over 50% of global copper demand. What happens in China far outweighs what happens in the US and Europe. For example, the infrastructure stimulus plans of the new Biden administration are expected to increase US steel demand by 3—5% from approximately 100 million tonnes per annum (mtpa) to 103—105mtpa. This pales into insignificance compared to Chinese steel demand of 1,000mtpa.
We can monitor Chinese demand by looking at a few key economic indicators, like its GDP growth together with the widely followed Li Keqiang index (figure 4), built by the Chinese Premier in the mid-2000s. Mistrusting official GDP figures, Li Keqiang’s index was based on real-world metrics like railway cargo volumes and electricity consumption, to get a better measure of industrial demand. Note how the Li Keqiang index shows industrial demand conditions through 2013 to 2015 were weaker for longer than the global recessions of 2009 and 2020. It was this period of slower growth which caused the mining downturn. Following a spike in 2020 as the economy started reopening, demand may now be slowing. The primary tool used by the Chinese government to manage the economy is the supply of credit. Figure 5 shows the ‘credit impulse’ — the percentage change in the amount of credit supplied compared to the previous year.
The longer period of slowing credit supply from 2011 to 2015 corresponded with the previous mining downturn. After a burst of credit growth in response to COVID, the credit impulse has turned negative again as China’s policymakers attempt to cool down the economy. Shorter term demand growth for metals looks to have peaked.
In the longer term, Chinese demand for metals may also face a structural headwind that has not been seen before — China’s newfound desire to combat global warming. Its economy is resource intensive and inefficient, accounting for over a quarter of global CO2 emissions. China’s recently announced plans to reach net zero emissions by 2060 will involve a large transition that will use far fewer resources. This could be a very different world from the commodities supercycle of the 2000s.
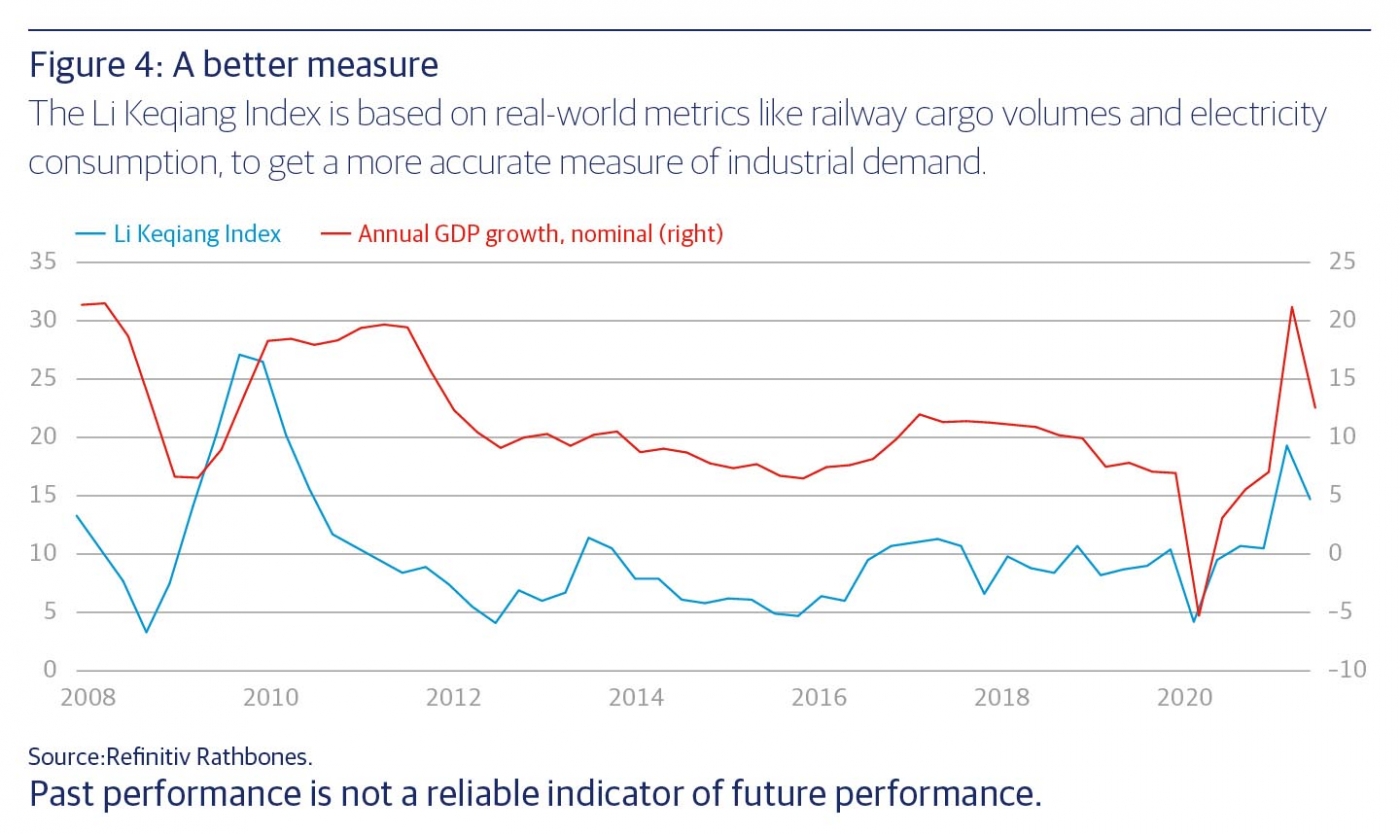
Figure 4: A better measure
The Li Keqiang Index is based on real-world metrics like railway cargo volumes and electricity consumption, to get a more accurate measure of industrial demand.
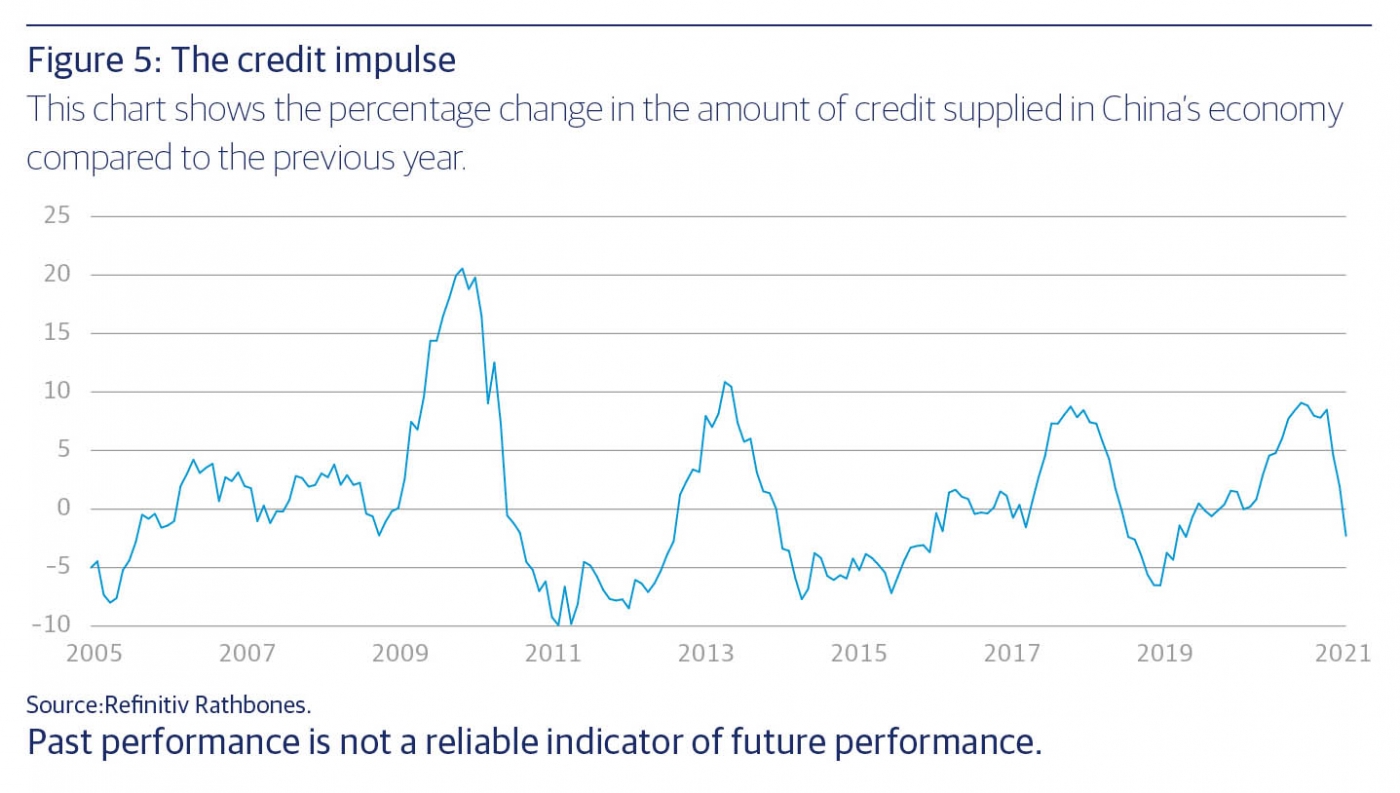
Figure 5: The credit impulse
This chart shows the percentage change in the amount of credit supplied in China’s economy compared to the previous year.
This article has been taken from, 'Q3 2021 Investment Insights', read the full publication here.


